Ecological complexity
Visualizing the complexity of an ecological system over time
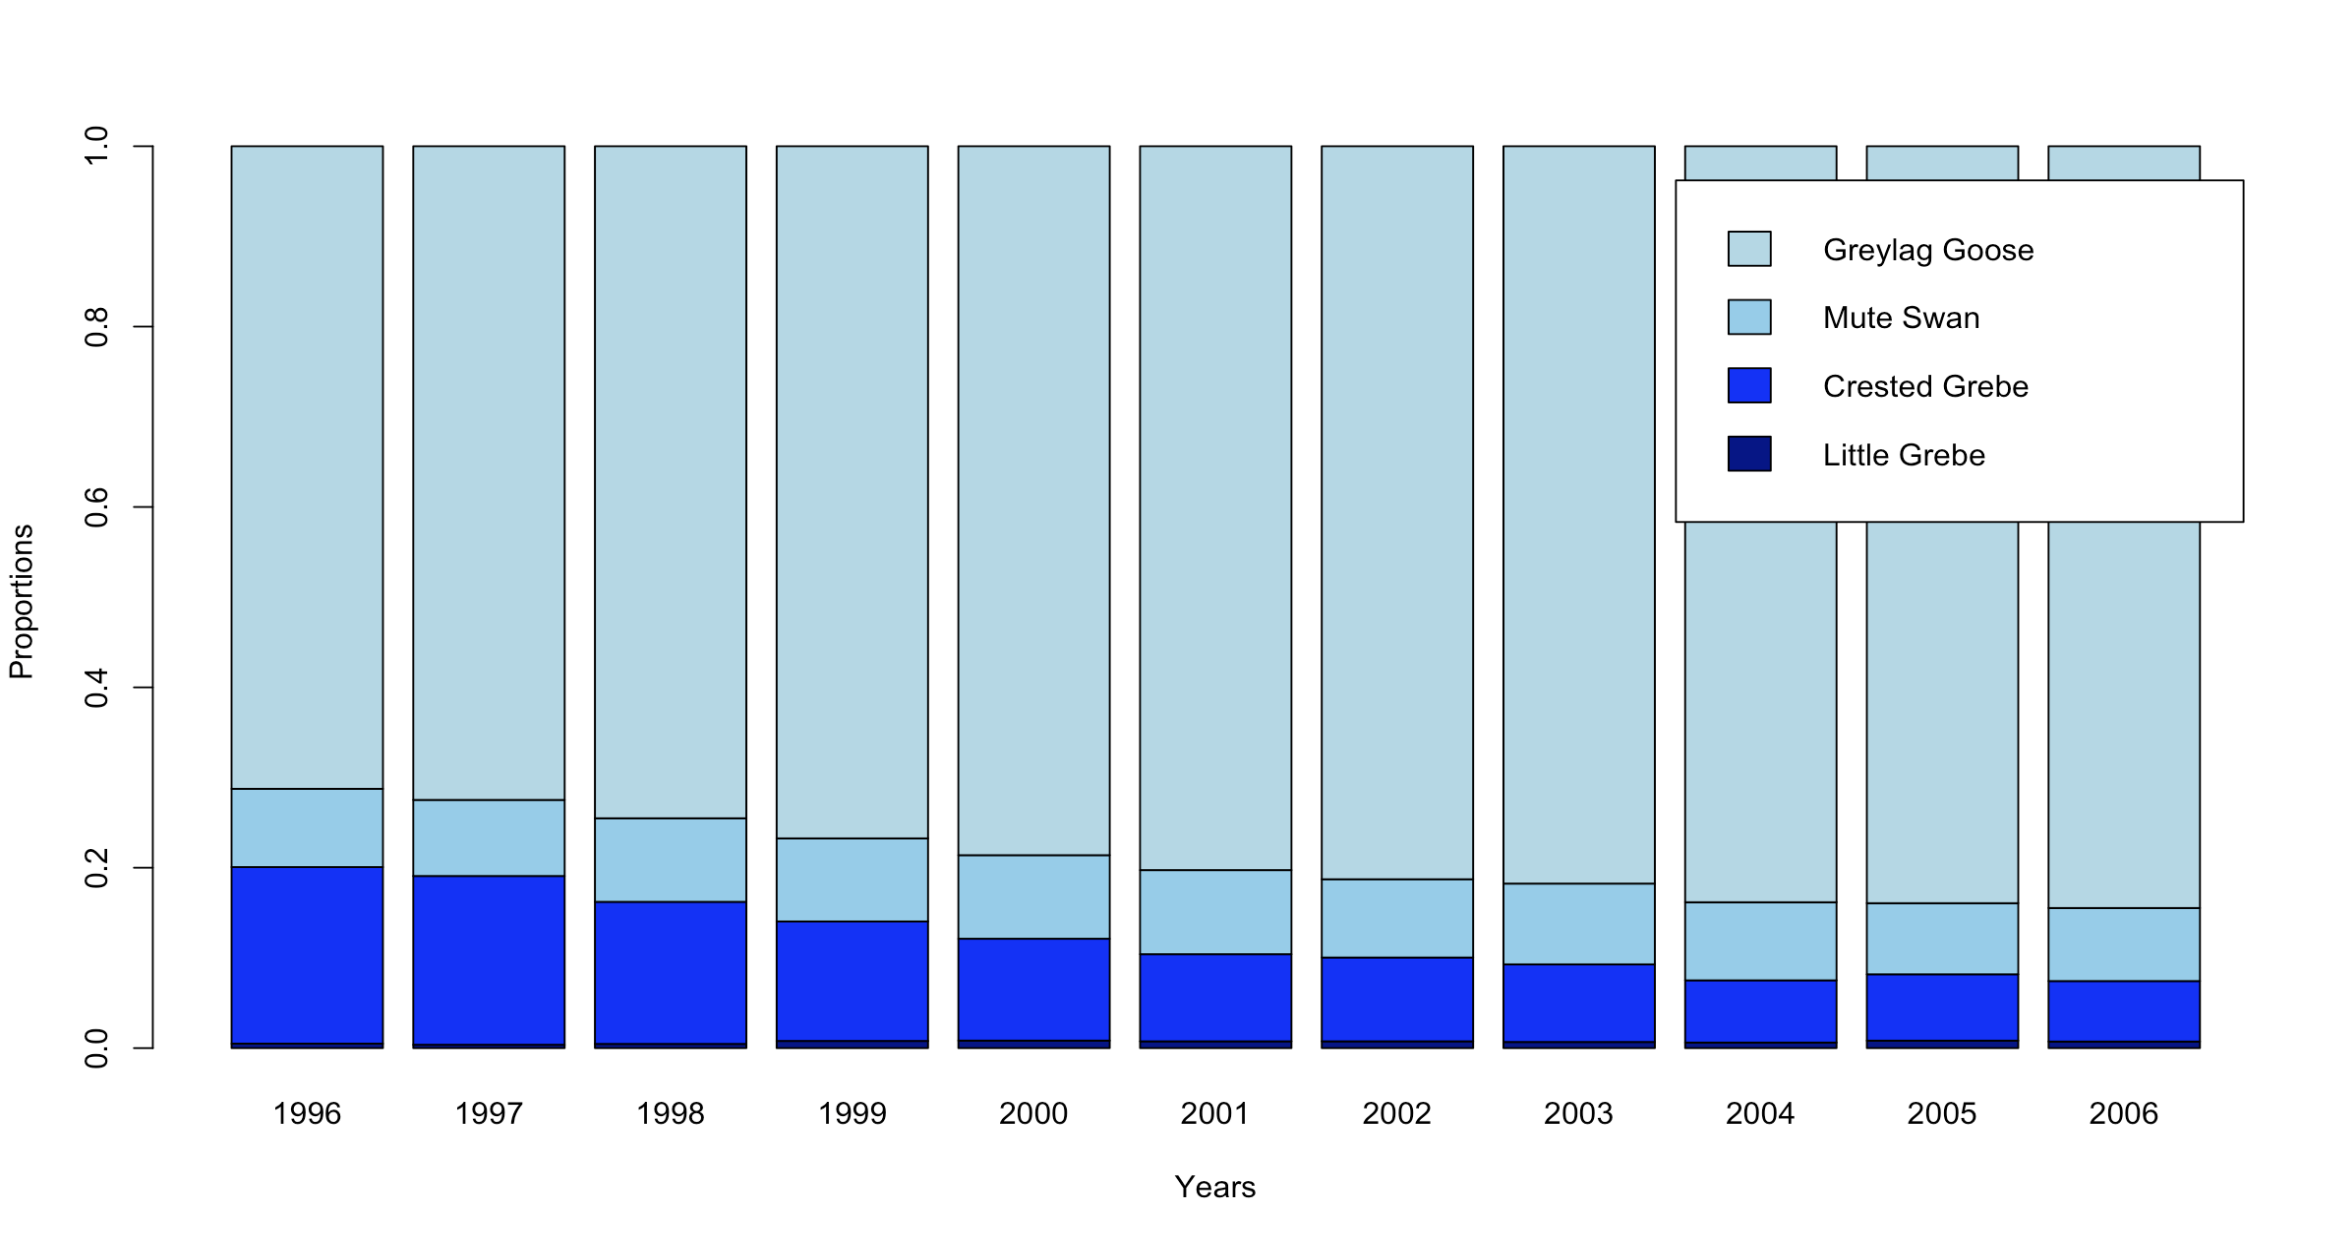
We can use the diverse R package to explore a dataset on geese population in the Netherlands. This dataset is gathered by the Sovon Dutch Centre for Field Ornithology. There are 4 species of geese, examined over the course of a 10 year period.
In the first figure we can look at the proportions of species over the years:
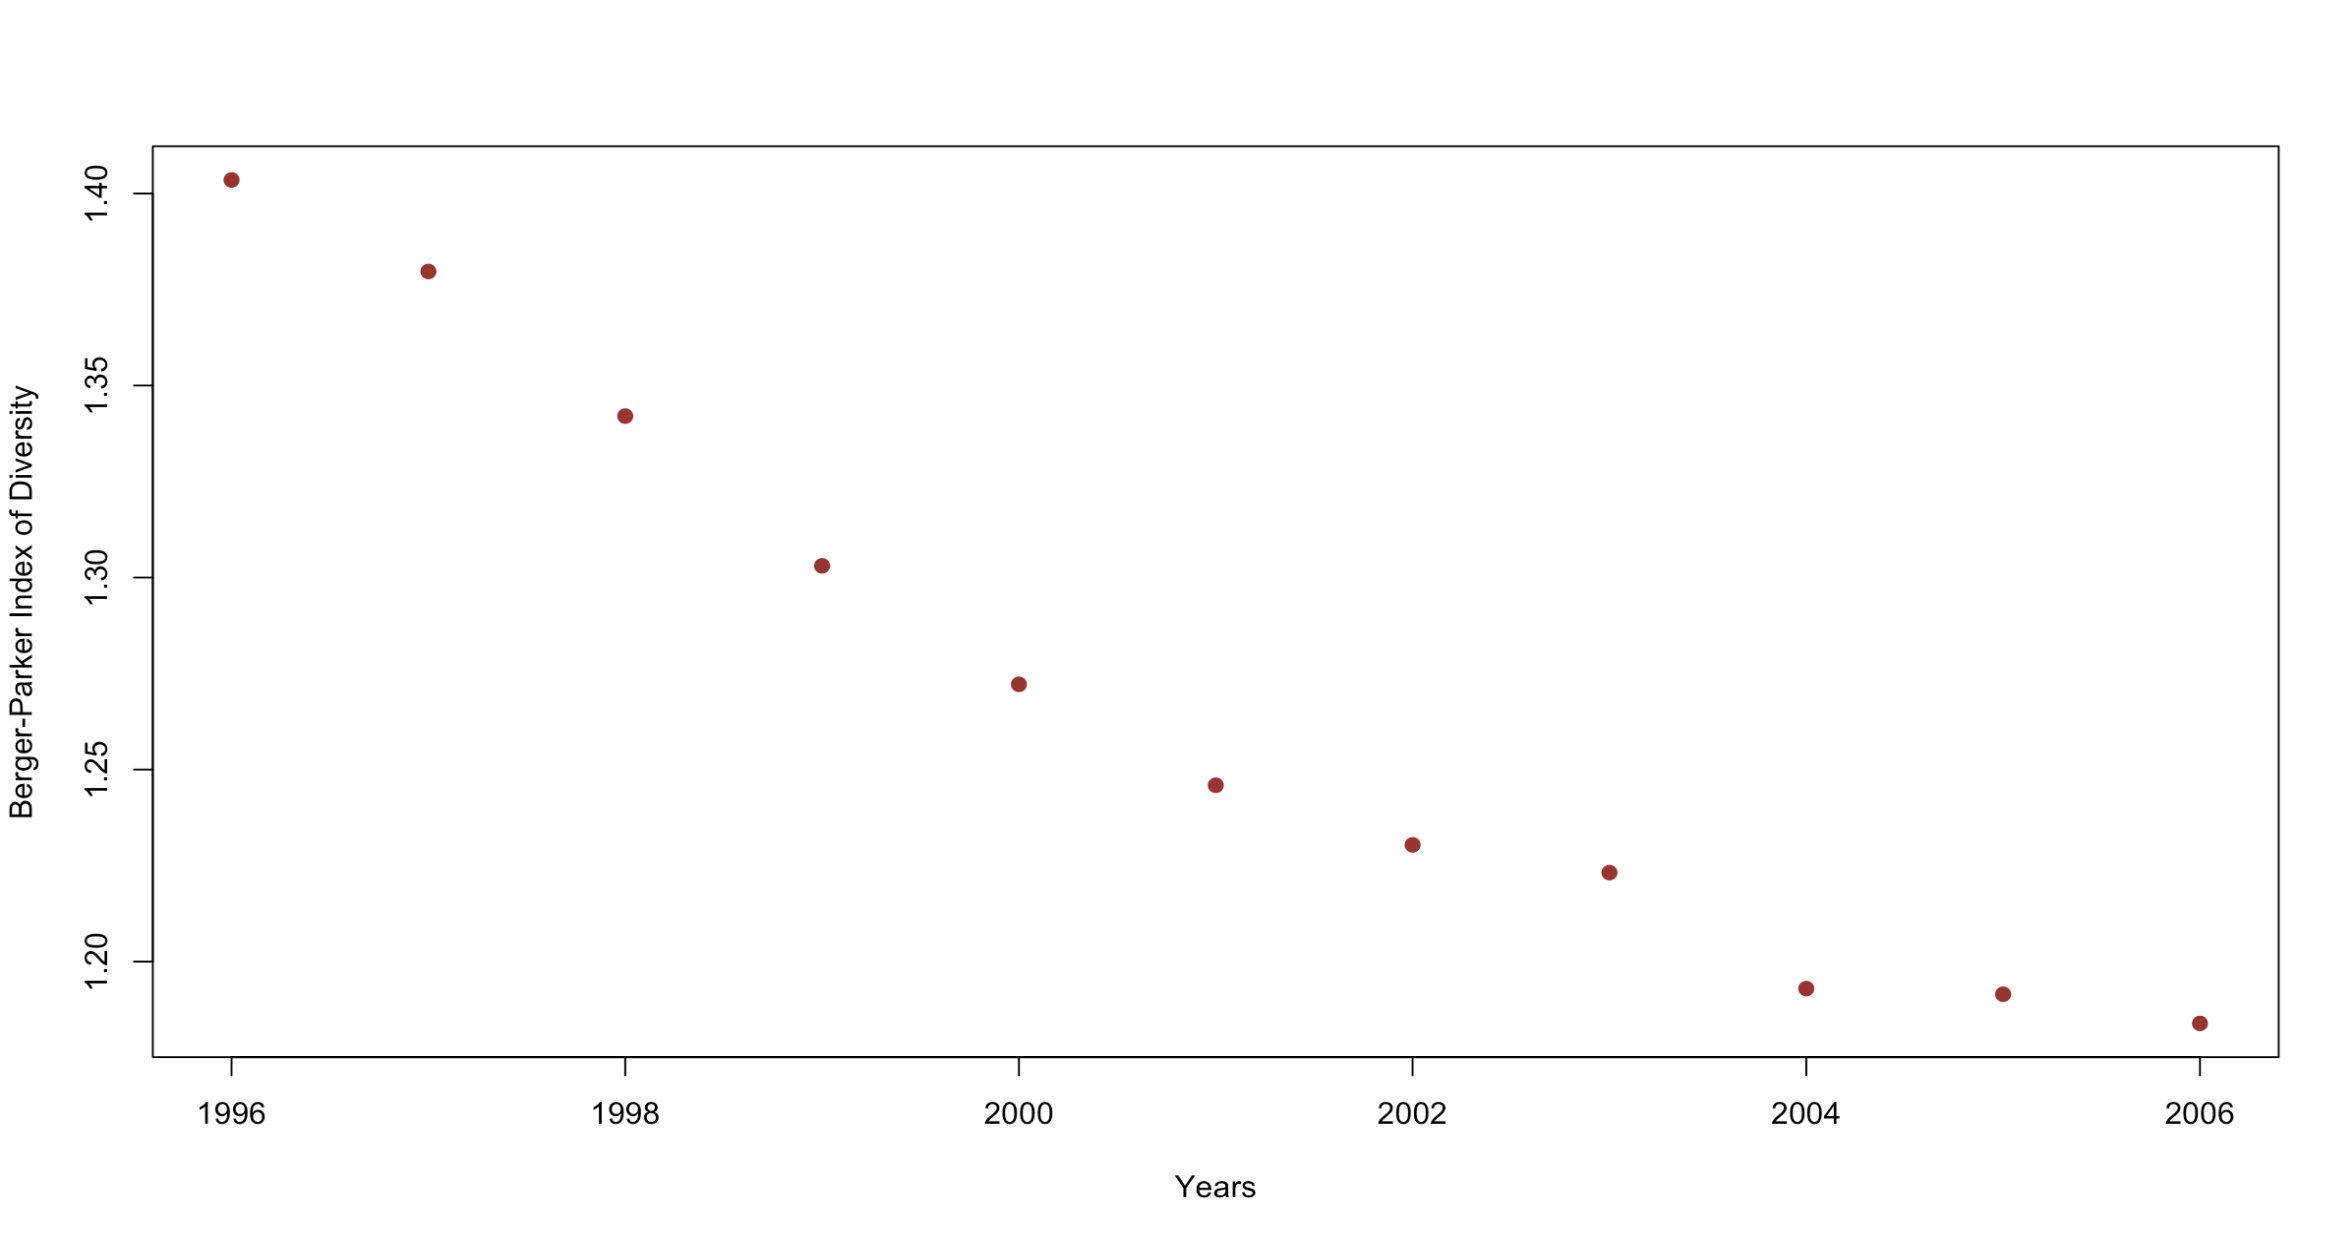
To dive deeper let's calculate the Berger-Parker Index of diversity:
Where: - \(d\) is the Berger-Parker Index of Diversity. - \(n_{\text{max}}\) is the abundance of the most dominant species. - \(N\) is the total abundance of all species.
And plot how it has been falling:
Species richness of freshwater ecosystems
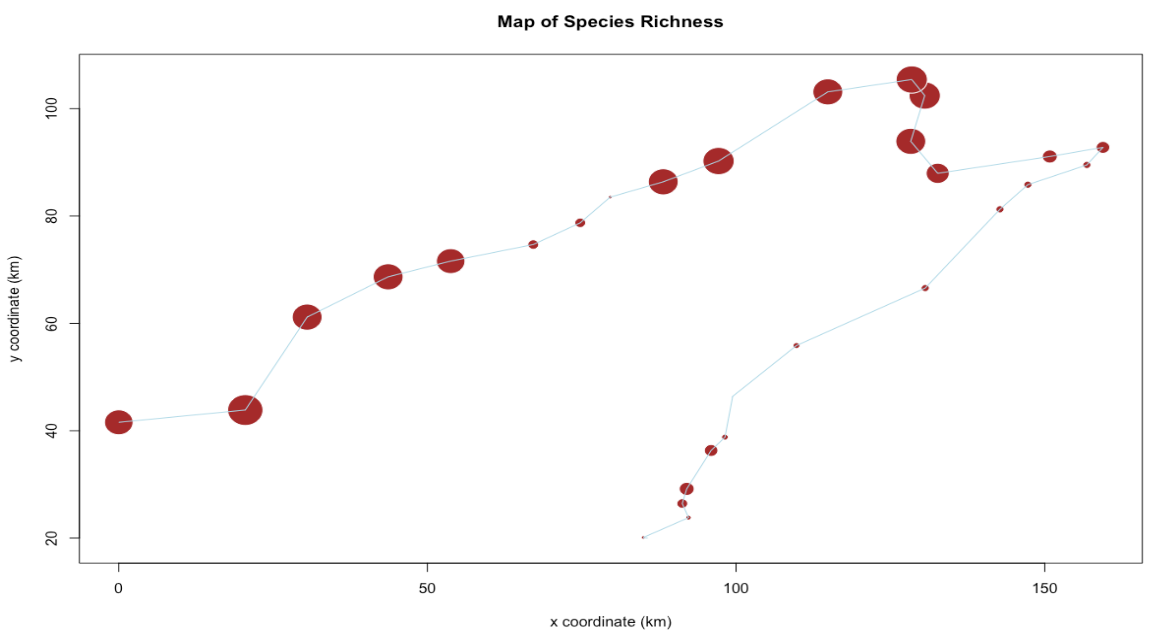
Another useful ecological source of data is the Doubs dataset. It contains information about various environmental factors and species counts of fish communities in the Doubs River (Switzerland). Let's use it to visualize species richness based on the following formula:
Where: - \( S \) is the species richness. - \( x_i \) represents the abundance of species \( i \). - \( n \) is the total number of species.
We can plot the results onto the sampling sites:
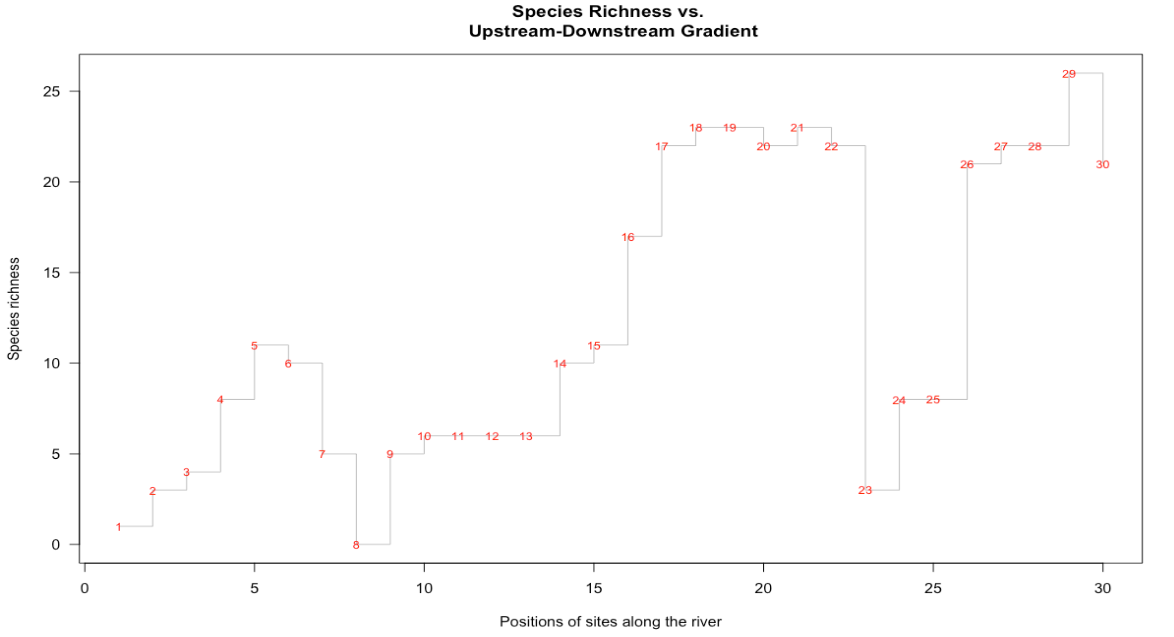
Another way to visualize the same data is to plot the species richness against the position on the river. In this case the patterns can become clearer:
References
- Guevara, Miguel R., Dominik Hartmann, and Marcelo Mendoza. "diverse: an R Package to Analyze Diversity in Complex Systems." R J. 8.2 (2016): 60.
- Borcard, Daniel, François Gillet, and Pierre Legendre. Numerical ecology with R. Vol. 2. New York: Springer, 2011.